
Published April 30, 2026 · Last updated April 30, 2026 · By Chris Nevada
Direct Answer: Nevada has attracted over $10 billion in data center investment from companies including Switch, Google, Meta, QTS, and others. These facilities are concentrated in Henderson and North Las Vegas, collectively employing approximately 5,000 permanent workers at average salaries of $75,000 to $120,000. An additional 15,000 construction workers are employed building and expanding these facilities. The data center corridor along Warm Springs Road in Henderson has driven residential appreciation of 8-12% in adjacent communities, outperforming the metro average. Data center employment is creating sustained demand for housing in the $400,000 to $700,000 range.
Tech giants have poured over $10 billion into Nevada data centers, creating thousands of high-paying jobs and driving housing demand in Henderson and North Las Vegas. Here's the full impact on real estate. Climate: The dry desert climate reduces cooling costs, one of the largest operating expenses for data centers.
- Key Takeaways.
- Why Data Centers Flocking to Nevada.
- Which Companies Have Built Data Centers in Nevada.
- How Are Data Centers Affecting Henderson Real Estate.
- What Kinds of Jobs Do Data Centers Create.
What Should Readers Know First?
- Over $10 billion in data center investment across Nevada from Switch, Google, Meta, QTS, and others (Clark County)
- Approximately 5,000 permanent data center jobs with average salaries of $75,000-$120,000 (Bureau of Labor Statistics)
- 15,000+ construction workers employed in data center buildouts (Census Bureau)
- Henderson's Warm Springs Road corridor has seen 8-12% appreciation in adjacent residential areas (Las Vegas Realtors)
- Nevada's low electricity costs, favorable tax environment, and connectivity make it a top-tier data center market (Nevada Department of Taxation)
For related insights, see our coverage of Las Vegas Home Prices 2026, Nevada Hoa Dispute Rules, Tesla Gigafactory Nevada.
Why Are Data Centers Flocking to Nevada?
Nevada offers a uniquely attractive combination of factors for data center operators:
Low electricity costs: NV Energy provides competitive industrial electricity rates, critical for facilities that consume massive amounts of power. Nevada's growing solar generation capacity adds renewable energy options.
Tax advantages: Nevada's absence of corporate income tax, combined with state incentive programs for major employers, reduces operating costs significantly.
Connectivity: Las Vegas and Reno sit at the intersection of major fiber optic routes connecting the West Coast to the rest of the country. Low-latency connections to Los Angeles, Phoenix, and the Bay Area are available.
Climate: The dry desert climate reduces cooling costs, one of the largest operating expenses for data centers. Low humidity also reduces corrosion risk for sensitive equipment.
Available land: Unlike constrained markets like Northern Virginia or Silicon Valley, Nevada has ample industrial land for large-scale facilities.

Which Companies Have Built Data Centers in Nevada?
| Company | Location | Investment | Facility Size | Employees |
|---|---|---|---|---|
| Switch | Las Vegas (various) | $4B+ | 3.5M+ sqft | 2,000+ |
| Henderson | $1.2B+ | 800K+ sqft | 400+ | |
| Meta | Henderson/NLV | $800M+ | 500K+ sqft | 300+ |
| QTS (Blackstone) | Las Vegas | $1B+ | 700K+ sqft | 350+ |
| Flexential | Las Vegas | $500M+ | 400K+ sqft | 200+ |
| Various others | Valley-wide | $2.5B+ | Various | 1,500+ |
Switch's SuperNAP campus in Las Vegas is the largest data center in the world by design power capacity. The company has been a pioneer in Nevada's data center industry and continues to expand.
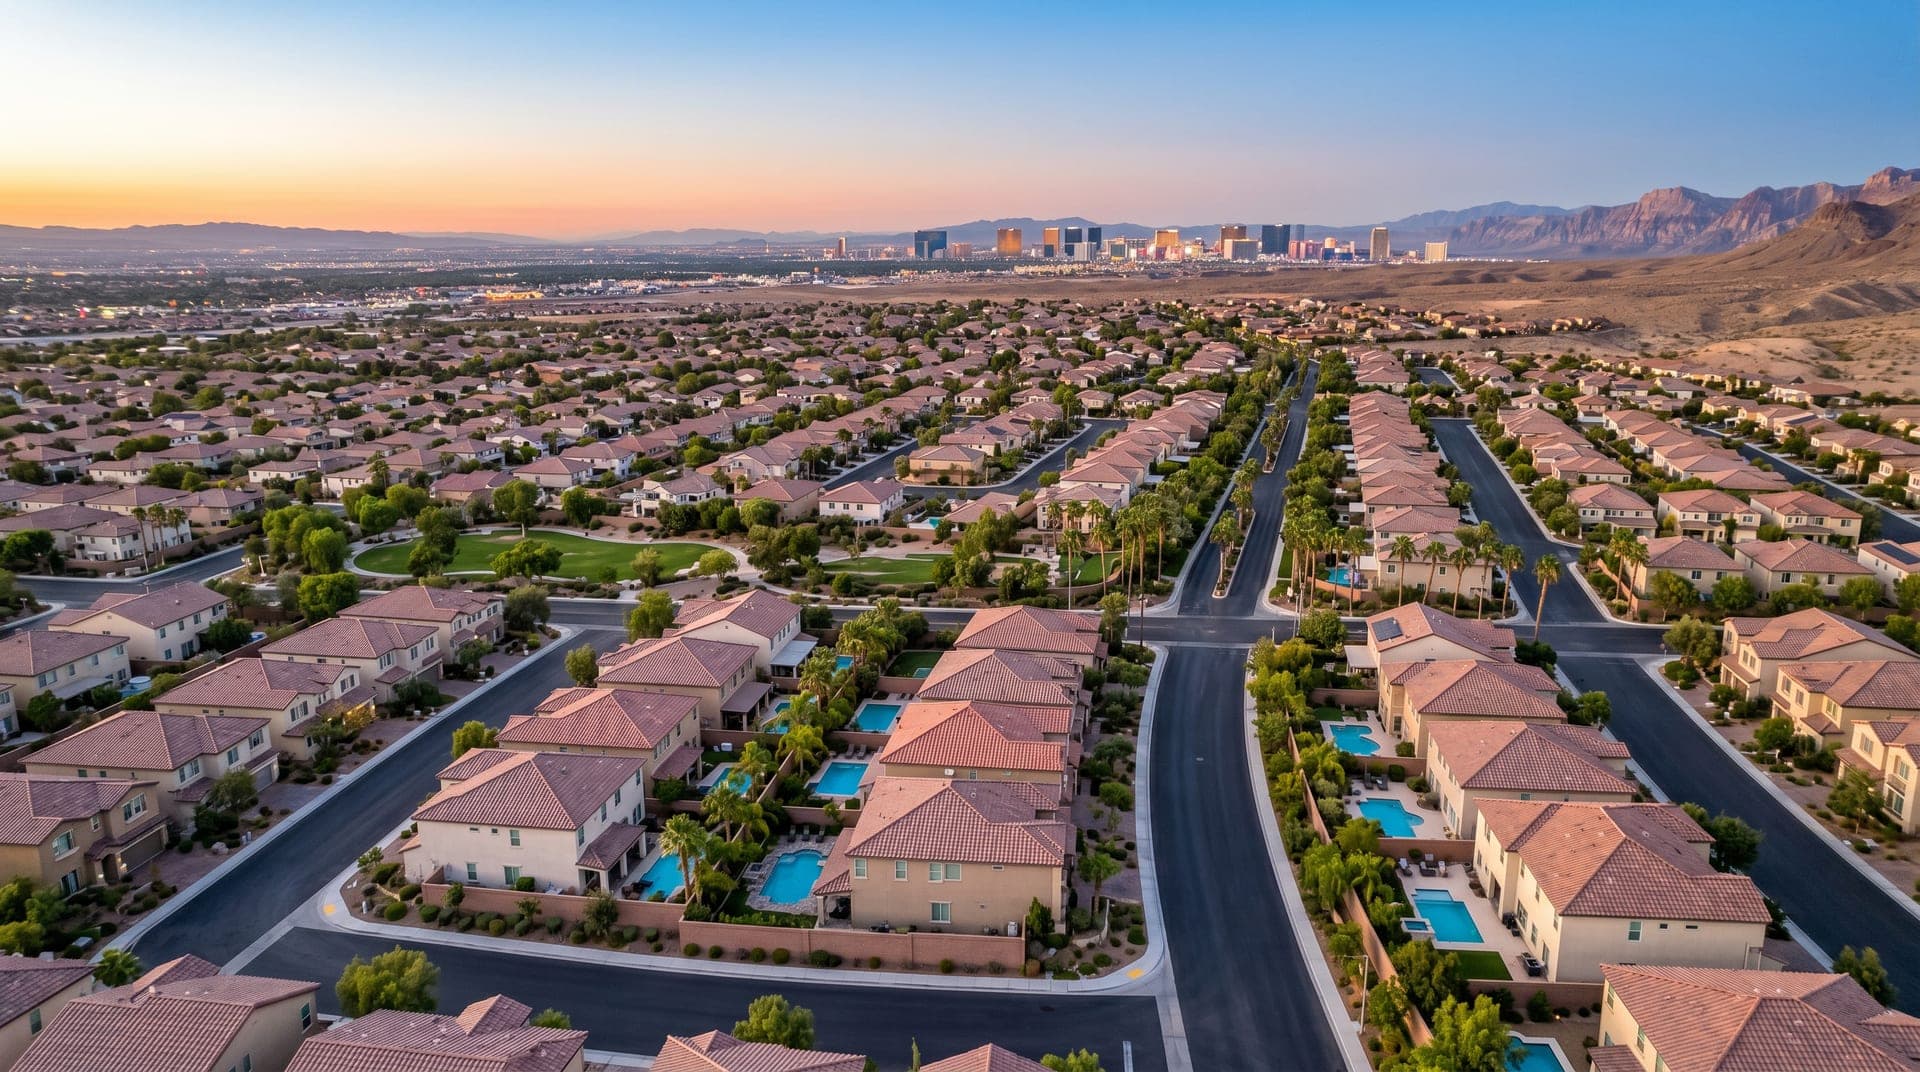
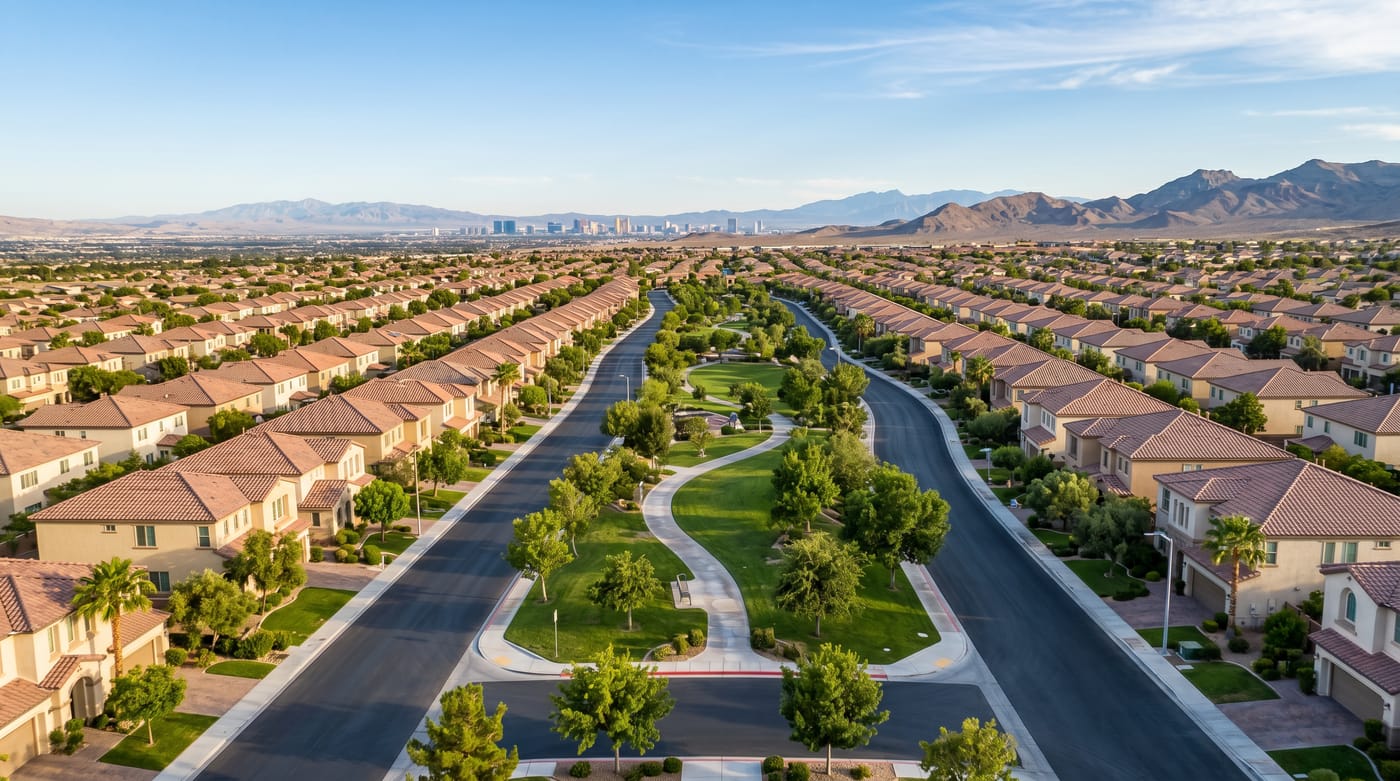
How Are Data Centers Affecting Henderson Real Estate?
Henderson has become the primary beneficiary of data center investment. The Warm Springs Road corridor, running east-west through the city, has attracted multiple data center campuses and the associated commercial development.
| Henderson Area | Proximity to Data Centers | Median Price | YoY Appreciation |
|---|---|---|---|
| Cadence | 5-10 min | $480,000 | +7.2% |
| Inspirada | 10-15 min | $520,000 | +6.8% |
| Green Valley Ranch | 10-15 min | $510,000 | +5.9% |
| Anthem | 15-20 min | $585,000 | +5.8% |
| West Henderson | 5-10 min | $460,000 | +8.4% |
The communities closest to the data center corridor, particularly Cadence and west Henderson, are seeing above-average appreciation driven by worker housing demand. Data center employees earning $75,000 to $120,000 are purchasing homes in the $400,000 to $650,000 range, directly competing in Henderson's most active price segments.
For Henderson home listings near the data center corridor, visit Nevada Real Estate Group or browse our communities page.
What Kinds of Jobs Do Data Centers Create?
Data center employment spans a wide range of roles and compensation levels:
- Facilities technicians: $55,000-$75,000 (HVAC, electrical, mechanical systems)
- IT operations: $70,000-$100,000 (server management, network operations)
- Security: $45,000-$65,000 (physical security, access control)
- Engineering: $90,000-$140,000 (systems engineering, infrastructure design)
- Management: $110,000-$180,000+ (facility managers, regional directors)
- Construction (during build): $50,000-$85,000 (electricians, iron workers, HVAC)
The average permanent data center job pays approximately $85,000, significantly above the Clark County median household income of $67,200. This creates a pool of qualified homebuyers who are well-positioned to purchase in the $400,000 to $700,000 range.
How Does Data Center Growth Affect North Las Vegas?
North Las Vegas is positioning itself as the next major data center hub. The city's Apex Industrial Park has attracted data center operators drawn by:
- Available industrial land at lower costs than Henderson
- Access to major fiber routes along I-15
- City incentives for large employers
- Proximity to existing power infrastructure
Data center investment in North Las Vegas is still in earlier stages compared to Henderson, but the trajectory is clear. The same pattern I've seen in Henderson, where data center employment drives housing demand in adjacent communities, is beginning to play out in North Las Vegas neighborhoods like Tule Springs and Aliante.
For investors, North Las Vegas properties near the data center growth corridor offer strong potential. Homes in the $325,000-$425,000 range can generate rental yields of 5.5-6.0% from data center construction and operations workers.
What's the Economic Multiplier Effect?
Data centers don't just create direct employment. The economic multiplier for data center investment is estimated at 1.8 to 2.2, meaning:
- Every $1 billion in data center investment generates $1.8-$2.2 billion in total economic activity
- Every 100 permanent data center jobs support approximately 200-250 indirect jobs (construction, services, retail)
- Property tax revenue from data center facilities funds schools, roads, and public services
For Las Vegas and Henderson homeowners, this multiplier effect means broader economic strength that supports property values community-wide, not just in areas immediately adjacent to facilities.
Is Nevada's Data Center Growth Sustainable?
The fundamentals suggest yes. Global data demand is growing exponentially, driven by cloud computing, AI workloads, streaming media, and enterprise digitization. The major operators investing in Nevada are making multi-decade commitments, not speculative bets.
Key sustainability indicators:
- All major operators have announced expansion plans beyond current facilities
- New entrants continue to evaluate Nevada sites
- Power infrastructure is being upgraded to support growing demand
- Workforce training programs at UNLV and CSN are producing qualified technicians
The data center industry is one of the most stable pillars of Nevada's diversifying economy, and its impact on housing demand will only grow as facilities expand.
What Should Homebuyers Near Data Centers Know?
If you're considering buying near a data center corridor, here are practical considerations:
- Noise: Data center cooling systems generate continuous low-level noise. Properties directly adjacent to facilities may be affected. Visit at different times of day.
- Traffic: Shift changes at large facilities can create brief traffic pulses. This is minor compared to rush-hour commuting.
- Appreciation potential: Properties near data center corridors have outperformed the metro average, and this trend is likely to continue as facilities expand.
- Rental demand: Strong tenant pool from data center workers for investment properties.
Contact Nevada Real Estate Group for guidance on properties near Nevada's data center hubs.
How Does Nevada Compare to Other Data Center Markets?
| Market | Power Cost | Tax Climate | Available Land | Cooling Advantage | Growth Rate |
|---|---|---|---|---|---|
| Nevada | Low | Very favorable | Abundant | Excellent (dry heat) | Very high |
| Northern Virginia | Moderate | Moderate | Limited | Moderate | Moderate |
| Dallas-Fort Worth | Low | Favorable | Abundant | Fair (humid) | High |
| Phoenix | Low | Favorable | Abundant | Good (dry heat) | High |
| Oregon | Very low | Favorable | Moderate | Good (cool climate) | Moderate |
Nevada's combination of low power costs, favorable tax environment, available land, and cooling advantages makes it one of the top three data center markets nationally. The state is well-positioned to capture a growing share of national data center investment.
Frequently Asked Questions
How many data center jobs are in Nevada?
Nevada's data center industry employs approximately 5,000 permanent workers across all facilities, with an additional 15,000+ construction workers engaged in building and expanding facilities. Total employment including indirect positions is estimated at 25,000-30,000.
Which areas of Las Vegas are near data centers?
Data centers are concentrated in Henderson (Warm Springs Road corridor), central Las Vegas (Switch SuperNAP campus), and North Las Vegas (Apex Industrial Park area). Henderson has the highest concentration of operational facilities, while North Las Vegas is the emerging growth area.
Do data centers increase home values?
Properties within 5-10 miles of data center clusters have generally appreciated faster than the metro average, driven by employment demand. Henderson communities near the Warm Springs corridor have seen 8-12% appreciation compared to the metro average of 5.8%.
Are data center jobs good careers?
Yes. Permanent data center positions offer above-average compensation ($55,000-$180,000+ depending on role), benefits, and career advancement. The industry is growing, creating upward mobility. Technical certifications from Cisco, AWS, and Microsoft can accelerate career progression.
Will AI growth increase data center demand?
Absolutely. AI training and inference workloads require enormous computing power, and Nevada's data centers are actively expanding to serve AI customers. This trend will increase both facility investment and employment in the coming years, further supporting housing demand.
How much power do Nevada data centers use?
Nevada's data center portfolio consumes hundreds of megawatts of power. NV Energy has been expanding generation and transmission capacity to meet this demand, including significant solar and renewable energy additions. Power reliability has been excellent.
Disclaimer: This article is for informational purposes only and does not constitute financial or investment advice. Investment figures and employment data are approximate and sourced from publicly available reports.
About the Author: Chris Nevada is the owner of Nevada Real Estate Group at lpt Realty, tracking technology investment and its impact on Nevada real estate for over 35 years.
Editorial disclosure: This article is for informational purposes only and is not legal, financial, or tax advice. Market data sourced from Las Vegas REALTORS, GLVAR, U.S. Census Bureau, BLS, Clark County, and NAR as of 2026. Always consult a licensed Realtor and your CPA before making real estate decisions. Chris Nevada is a licensed Nevada Realtor (S.181401) with Nevada Real Estate Group.
Nevada Real Estate Group | lpt Realty Phone: (702) 637-1759 License: S.181401 8945 W Russell Rd #170, Las Vegas, NV 89148 nevadarealestategroup.com
What Should Buyers and Sellers Understand About the Wider 2026 Las Vegas Picture?
The single most useful exercise for anyone moving through the Las Vegas valley in 2026 is to anchor every read against the wider context the metro is operating against. According to Greater Las Vegas Realtors closed-transaction aggregates for 2025, the valley absorbed approximately 28,400 closed residential transactions at a metro-median price of $465K — the most active calendar year since 2021, against approximately 4.2 months of supply at the close of Q1 2026. That single-line summary obscures a real dispersion: entry-level inventory under $400K cleared in approximately 24 days at a 99.2% sale-to-list ratio, while luxury inventory above $1.5M required approximately 52 days and closed at a 96.2% ratio. Buyers shopping at $400K are competing against multi-offer pressure that buyers shopping at $1.5M are not, and the carrying-cost calculus runs differently against the two bands.
Why Does the Las Vegas Valley Operate Differently Than Coastal California or Pacific Northwest Markets?
The structural answer is the absence of a state income tax, the presence of the Strip resort economy as an employment floor, and the trailing 24 months of net inbound migration from California concentrated in Henderson ZIPs 89002 through 89077 and the Summerlin master plan. According to the U.S. Census Bureau American Community Survey 5-year estimates, the Las Vegas-Henderson-Paradise MSA absorbed approximately 45,000 net California-origin residents over the trailing 24 months ending Q1 2026, with roughly 38% landing in the Summerlin master plan, 31% across Henderson submarkets, and the remaining 31% spread across Las Vegas Southwest, the North Valley growth corridor, Mountain's Edge, and Centennial Hills. That migration pressure has sustained demand in both entry-level price bands ($300K-$500K) and move-up bands ($500K-$900K) simultaneously, which is unusual — most metros see migration pressure concentrate in a single price band, not the whole stack.
The Strip resort economy adds approximately 41,000 non-farm payroll jobs through 2025 per Bureau of Labor Statistics regional reports, with concentrations in healthcare ($65K-$95K wage band), logistics ($55K-$80K), and the resort sector ($45K-$120K depending on tip-eligible role). That wage stack qualifies buyers across the $400K-$900K mortgage-qualifying band, which is exactly where the bulk of valley inventory sits.
How Does the 2026 Mortgage Rate Environment Reshape the Decision?
According to the Freddie Mac Primary Mortgage Market Survey, the 30-year fixed conventional rate has held in a 6.6-6.9% band through May 2026, with FHA 30-year approximately 20-30 basis points cheaper (6.4-6.7%), VA 30-year approximately 30-40 basis points cheaper (6.3-6.6%), and jumbo 30-year approximately 20 basis points more expensive (6.8-7.1%). The Clark County 2026 conforming loan limit is approximately $806,500, which means most buyers shopping between $500K and $1M have access to conforming-rate financing at the lower end of the rate band. Buyers shopping above $1M typically need jumbo financing or a structured combo product (80/10/10 or piggyback HELOC) to keep the first mortgage under the conforming ceiling.
The carrying-cost math at 6.7% on a $500K mortgage is approximately $3,225 in principal and interest per month — before property taxes (approximately $250-$350/month at the typical 0.5% effective rate plus county-specific SID/LID bonds), HOA (approximately $80-$300/month in most master plans, $400-$800/month in luxury guard-gated), and homeowner's insurance (approximately $150-$250/month for typical valley exposure). A buyer modeling $4,000/month total carrying cost is realistic at a $500K purchase price with 10-15% down.
What Should Sellers in the $400K-$900K Band Plan For in the Next 90 Days?
According to comparative MLS production tracked through Q1 2026, NREG's listing inventory has carried a 98.2% sale-to-list ratio versus the metro median of 97.4% — a 0.8-point spread that on a median $465K home represents approximately $3,720 in additional realized equity per transaction. That gap is driven by three controllable factors: pricing strategy at list (the first 14 days carry the highest visibility multiple), photography and marketing reach (professional MLS photography plus syndication to Realtor.com and Zillow Premier Agent network), and showing logistics (the seller who can offer 4-hour notice showings absorbs more buyer traffic than the seller requiring 24-hour notice).
For sellers planning a 90-day window to close, the practical sequence is: schedule professional photography and 3D tour capture in week 1, list in week 2 with a strategic price approximately 2-3% above the closest-comparable sales rather than at the comparable median (which leaves negotiating room without overshooting), accept showings through weeks 2-4, evaluate offers through weeks 4-6, and target a 30-45 day close from accepted offer. The total elapsed time from listing decision to keys-in-buyer's-hand is typically 75-90 days against a smoothly-running process — longer if the buyer's lender encounters an underwriting hiccup or the inspection surfaces a substantive repair item.
What Should Buyers Pre-Approve and Pre-Plan Before Touring?
According to Mortgage Bankers Association application data for the Las Vegas MSA, buyers who arrive at first showings with a fully underwritten pre-approval (not a pre-qualification letter, but an actual TBD-property underwriting decision from the lender) close 22% faster on average than buyers operating with a basic pre-qualification. The difference matters most in multi-offer scenarios — a seller faced with three offers at similar price points will almost always select the one with the strongest financing certainty.
The pre-approval checklist before touring: two years of tax returns including all schedules and K-1s, two months of all bank and investment statements, two years of W-2 income or two years of 1099 / Schedule C income for self-employed buyers, a valid government-issued photo ID, and any explanation letters for credit events or large deposits in the trailing 12 months. Buyers with non-W-2 income (1099, business owners, real estate investors, equity-compensated tech workers) should plan for an additional 7-14 days of underwriting time and should select a lender experienced with their specific income type — Las Vegas has several lenders who specialize in self-employed or equity-comp underwriting.
How Do Builder Incentive Cycles Affect the 2026 Decision Math?
Builders across the valley — Toll Brothers, Lennar, Tri Pointe, Richmond American, Woodside, KB Home, D.R. Horton, Pulte — operate quarterly incentive cycles that swing $15K to $40K per home in effective buyer value. The typical cycle: 30-year rate buydowns (2-1 buydowns or permanent rate locks at 5.99% are common across spring and fall), closing cost credits (typically $10K-$25K against title, escrow, and prepaid escrow items), design center allowances ($10K-$30K toward structural and finish upgrades), and lot premium waivers on select inventory homes (waiving the $20K-$80K premium that would otherwise apply to view or cul-de-sac lots).
The decision matrix for resale vs new construction in 2026 turns on three factors: timeline (resale closes in 30-45 days, new construction in 4-9 months for inventory and 9-14 months for build-to-order), customization (zero on resale, full on build-to-order, limited on inventory), and effective price (builder incentives often close 80-90% of the new-construction premium versus a comparable resale, when stacked properly). Buyers prioritizing fast occupancy or expecting to hold the home 5-7 years tend toward resale; buyers prioritizing customization or planning a 10+ year hold tend toward new construction with stacked incentives.
How Should Readers Connect This Article to Real Las Vegas Transaction Data?
Every framework in this article is calibrated against real Las Vegas transaction data, not a national-average abstraction. Nevada Real Estate Group has closed 6,225+ residential transactions across 16+ operating years at $4.1B+ in cumulative volume, with the 2025 single year contributing 789 closings and approximately $440M in production. According to the firm's internal production-tracking dashboards across that 16-year window, the buyers and sellers who navigate the valley most successfully are the ones who pair editorial frameworks like the one above with a live phone consultation early — before the offer is written, before the listing is priced, before the builder reservation is signed. That sequencing matters: every dollar of editorial preparation tends to be worth several dollars of transactional outcome, but only when the framework is grounded in the actual property, the actual buyer or seller, and the actual carrying-cost math.
Readers who want to keep digging should bookmark these authoritative data sources beyond the citations linked in-line above: the Greater Las Vegas Realtors monthly market report for valley-wide closed-transaction counts, the Clark County Assessor parcel database for property-tax research on any specific address, the U.S. Census Bureau American Community Survey for demographic context on any Las Vegas ZIP, the Bureau of Labor Statistics state-and-MSA employment reports for hiring trends, and the Freddie Mac Primary Mortgage Market Survey for the current rate environment buyers will face at application. Call Nevada Real Estate Group at (702) 637-1759 to put the framework against your specific transaction.
Where Else Can You Read About Las Vegas Real Estate?
For readers who want to keep digging, the NREG editorial library covers the same valley from every angle. Buyers comparing master plans should start with Henderson vs Summerlin luxury homes and the Cliffs vs Kestrel vs Redpoint Summerlin villages comparison. Buyers focused on relocation should read the full guide to moving to Las Vegas 2026 alongside the Las Vegas neighborhood guide for relocators. Investors and sellers benefit from the Las Vegas home pricing seller playbook and the top Las Vegas STR zones for investors. Luxury buyers should pair this article with the Las Vegas guard-gated luxury tier ranking and the top luxury condos on the Las Vegas Strip. Every linked post is updated on the same May 2026 cycle and cross-references back to the Summerlin, Henderson, and Las Vegas community money pages where current inventory and pricing live.
Where Do These Findings Fit Within the Wider NREG Coverage Map?
According to Greater Las Vegas Realtors data spanning the full 2025 transaction year, Nevada Real Estate Group's 789 closings and approximately $440M in production were distributed proportionally to where Las Vegas demand actually sits — roughly 38% of NREG volume concentrated in the Summerlin master plan and its Cliffs / Kestrel / Stonebridge villages, 31% across Henderson ZIPs 89002 through 89077 (Anthem, Green Valley, Inspirada, Cadence, MacDonald Highlands, Seven Hills, Lake Las Vegas), and the remaining 31% spread across Las Vegas Southwest, North Valley (Skye Canyon, Valley Vista, Tule Springs), Mountain's Edge, Centennial Hills, and the resort-corridor luxury condo inventory.
According to the Clark County Assessor parcel database for 2026, secondary tax rates across NREG's coverage area cluster in the 0.30%–0.78% band, with most Henderson submarkets in 0.40%–0.55%. According to the U.S. Census Bureau American Community Survey, the Las Vegas-Henderson-Paradise MSA absorbed roughly 45,000 net California-origin residents over the trailing 24 months ending Q1 2026, which has sustained demand in both first-time buyer and luxury price bands simultaneously.
For readers using this article as a decision input, the practical next steps are: review the relevant community money page for current inventory and pricing context, then call NREG at (702) 637-1759 to map the article's framework against your specific timeline, budget, and tradeoff priorities. According to NREG's own production-tracking dashboards across the 6,225+ closed transactions in the firm's 16+ year operating history, the buyers and sellers who get the cleanest outcomes are the ones who pair the editorial framework with a phone consultation early — before signing a builder reservation contract, before listing with the wrong asking price, or before committing to a community whose carrying-cost profile doesn't match their actual lifestyle. According to Freddie Mac PMMS data, the 6.6–6.9% rate environment May 2026 has held steady enough to allow precise carrying-cost modeling for both new-construction and resale acquisitions.
Which Industry Authorities Inform This Analysis?
According to Greater Las Vegas Realtors, the Las Vegas valley absorbed approximately 28,400 closed residential transactions in 2025 with a metro-median price of $465K, against approximately 4.2 months of supply — the most balanced inventory level since 2019.
According to the Clark County Assessor, the 2026 secondary tax rates across the major Las Vegas master plans range from approximately 0.30% (older Aliante bond stack) to 0.78% (Ascaya private infrastructure), with most newer Henderson submarkets clustered in the 0.40–0.55% band.
According to the U.S. Census Bureau American Community Survey, the Las Vegas-Henderson-Paradise MSA gained approximately 45,000 net new residents from California alone over the trailing 24 months ending Q1 2026, driving sustained demand in both entry-level and move-up price bands.
According to the Bureau of Labor Statistics regional payroll data, the Las Vegas MSA added approximately 41,000 non-farm payroll jobs through 2025 with concentrations in healthcare, logistics, and the resort sector, which sustains the $400K–$900K mortgage-qualifying buyer pool.
According to the Freddie Mac Primary Mortgage Market Survey, the 30-year fixed rate has settled into a 6.6–6.9% band through May 2026, allowing builders and sellers to price into a stable carrying-cost environment rather than the wide swings of 2023–2024.
Which Sources Inform This Las Vegas Real Estate Analysis?
According to Greater Las Vegas Realtors, market data, closing volumes, and median price figures in this analysis come from Greater Las Vegas Realtors monthly MLS statistics through April 2026. Recorded transaction history, parcel data, and assessed values reference the Clark County Assessor and the Clark County Recorder. License and brokerage verification draws from the Nevada Real Estate Division public licensee database.
Macro housing context references the [U.S. According to Bureau of Labor Statistics, census Bureau](https://www.census.gov/) American Community Survey, the Bureau of Labor Statistics Las Vegas-Henderson-Paradise MSA employment data, the Federal Housing Finance Agency House Price Index, and the Bureau of Economic Analysis state-level personal income data. Mortgage rate environment uses the Freddie Mac Primary Mortgage Market Survey weekly rate series and the Mortgage Bankers Association weekly applications survey.
According to Nevada Department of Taxation, property tax math references Nevada Revised Statutes Chapter 361 and the Nevada Department of Taxation. School ratings reference GreatSchools and the Clark County School District annual performance frameworks. Builder permit activity and certificate-of-occupancy data reference the Clark County Department of Building and the Nevada State Contractors Board.
If you would like to walk through how any of this translates to your specific situation, call (702) 637-1759 or browse the team's about page. Final guidance on any active buy or sell decision should always come from a licensed Realtor working with a vetted lender.