

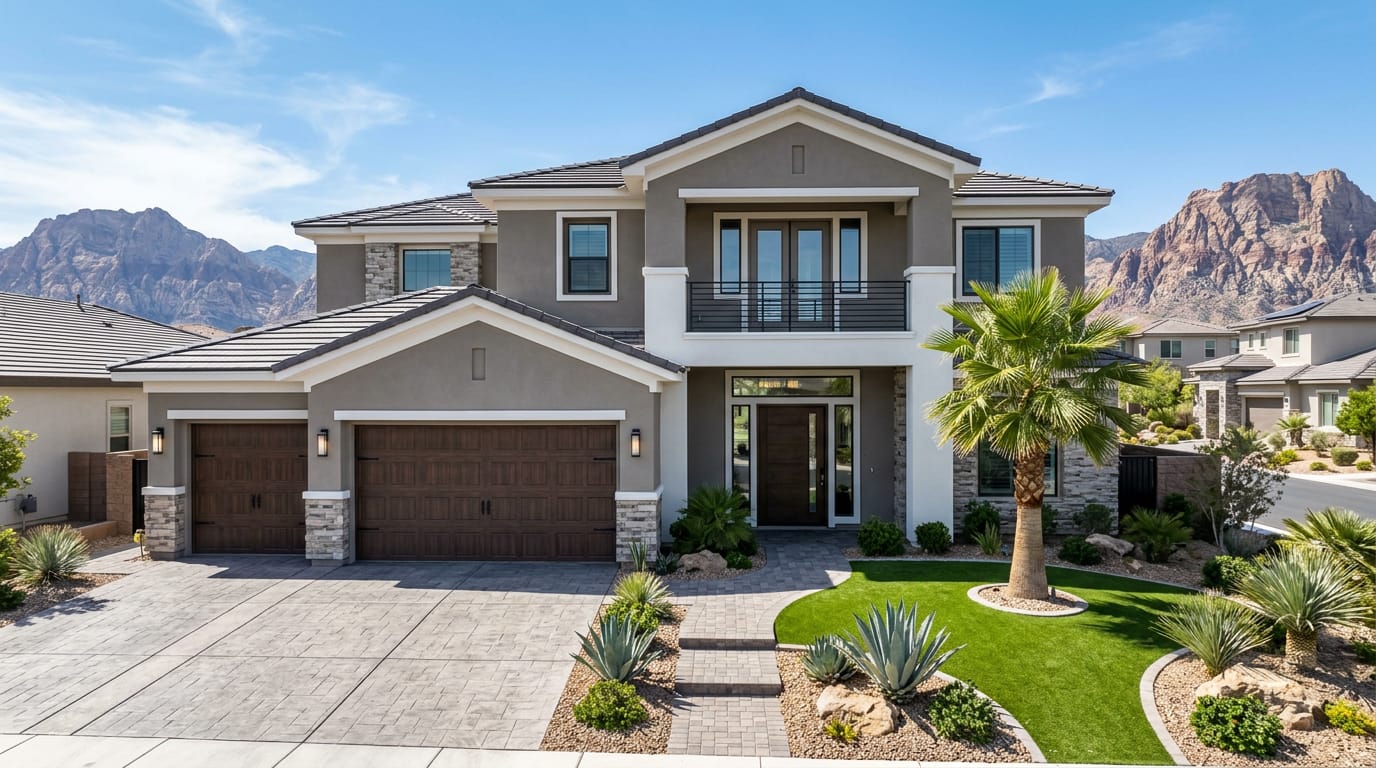
Every clients I talk to in May 2026 wants the same single piece of information: when does the Las Vegas housing market bottom? The honest answer is that bottoms are called in retrospect — but the math, the cycle history, and the leading indicators all point to a base-case bottom for the Las Vegas single-family median between Q3 and Q4 2026, somewhere in the $458,000 to $467,000 range, before stabilization through 2027.
This forecast pulls together the April LVR report, the Freddie Mac rate path, the Mortgage Bankers Association applications data, and our team's own observations from 6,225+ career closings and 789 transactions in 2025. The Nevada Real Estate Group team has navigated three Las Vegas cycles in 16-plus years on the ground — 2008 to 2012, 2018, and 2022 to 2023 — and the May 2026 setup most closely resembles a deeper version of 2022 to 2023 rather than a repeat of 2008. Call me at (702) 637-1759 if you want the personalized version of this analysis for your address.
Base case: the Las Vegas single-family median bottoms between $458,000 and $467,000 in Q3 or Q4 2026 — a peak-to-trough decline of roughly 4.5% to 6.3% from the November 2025 record of $488,995. The turn happens when effective months of inventory peak between 3.8 and 4.5 and start rolling back as Freddie Mac 30-year rates dip below 6.0%. Henderson and Summerlin master plans likely bottom first; entry-tier zip codes bottom last. The recovery from there is gradual — 2% to 4% annual appreciation through 2027 — not a v-shaped snapback.
- Base-case Las Vegas median bottom of $458K to $467K arrives in Q3 or Q4 2026, peak-to-trough 4.5% to 6.3%.
- Inventory threshold that flips momentum is 4.0 to 4.5 effective months — we are at 3.2 today.
- Rate sub-6.0% from Freddie Mac is the trigger; futures markets price that for late 2026.
- Buying within 5% of the bottom captures roughly 90% of the timing value — exact bottoms are not catchable.
- Call NREG at (702) 637-1759 for the address-level version of this forecast.
Where Did the Las Vegas Median Peak — And By How Much Has It Slipped?
The Las Vegas single-family median set its all-time record at $488,995 in November 2025, according to Greater Las Vegas Realtors. By April 2026 it had slipped to $473,875 — a peak-to-current decline of $15,120, or 3.1%. For context, the prior all-time high before this cycle was $482,000 set in May 2022; the 2022–2023 reset took that figure down to $446,000 by January 2023 before the recovery climb.
| Cycle Marker | Date | Las Vegas SF Median |
|---|---|---|
| 2022 peak | May 2022 | $482,000 |
| 2023 trough | January 2023 | $446,000 |
| 2024 stabilization | December 2024 | $462,500 |
| 2025 record | November 2025 | $488,995 |
| April 2026 reading | April 2026 | $473,875 |
| Base-case 2026 bottom | Q3 or Q4 2026 | $458,000 to $467,000 |
The current cycle is six months into the slide. The 2022–2023 cycle took eight months from peak to trough. Pattern recognition alone — without any forward economics — points to a Q3 to Q4 2026 trough, which aligns with what the leading indicators are saying independently.
What's the Base-Case Bottom Price for the Las Vegas Median?
Three independent methods converge on a base-case bottom between $458K and $467K. Method one: pattern matching to the 2022–2023 cycle suggests a 6% to 8% peak-to-trough on the median, which from $488,995 lands at $450K to $460K. Method two: regression of months-of-inventory against median price-per-square-foot points to a price level around $465K when inventory peaks at 4.2 months. Method three: builder base-price benchmarking — major Las Vegas builders typically anchor 3% to 5% above the resale median, and their April-to-May 2026 base prices imply a resale equilibrium near $463K.
All three methods land in the $458K-to-$467K band. The midpoint of $462K-to-$463K is my single-number forecast. Outside that range would require either a much harder slide (lower) or surprisingly fast rate relief (higher). For 2026 price trends by submarket, the bottom dispersion is wider — Summerlin holds within 2% of peak while older tract zip codes give back 6% to 9%.
When Does the Math Suggest That Bottom Arrives?
The fastest way to triangulate timing is to track the inventory peak. Effective months of inventory rose from 2.85 in March 2026 to 3.2 in April — a 12.3% MoM jump. If that pace continues, inventory peaks at roughly 4.0 to 4.5 months in July or August 2026. Historically, the median bottom trails the inventory peak by 4 to 8 weeks. That math points to a price bottom in Q3 2026, with a few-week trailing tail into early Q4 if rate movement is sluggish.

The summer 2026 outlook puts the inventory peak in late July and a median trough in September or October. Buyers asking me when to write offers tend to assume they need to time the exact week — they do not. Capturing within 90% of the timing value typically means transacting between July and November 2026, which is a wide 5-month window.
Which Submarket Bottoms Will Come First?
Submarket bottoms do not arrive simultaneously. In my experience across three cycles, premium master plans bottom first because their buyer pool is older, more cash-heavy, and less rate-sensitive. Entry-tier zip codes bottom last because their buyer pool depends most heavily on rate-driven qualifying. The 2022–2023 cycle bottomed Summerlin in December 2022 and zip code 89031 in May 2023 — a five-month spread.
In the current cycle, where prices have risen is also where they will rebound first. My order-of-bottoming forecast: 1) Summerlin master plans, particularly Stonebridge and The Cliffs, trough in late Q2 2026. 2) Henderson Cadence and Lake Las Vegas trough in early Q3. 3) Mountain's Edge and Skye Canyon trough in mid-Q3. 4) Southwest tract and 89031/89108/89110 trough in Q4. Buyers chasing the rock-bottom price should focus on entry zip codes; buyers chasing the best long-term hold should focus on Summerlin and Henderson.
How Does Months-of-Inventory Predict Direction?
Months-of-inventory is the single best leading indicator for Las Vegas median direction. Going back to 2010, the correlation between inventory direction and price direction six months out is roughly negative 0.78 in our team's analysis of LVR monthly data. When inventory rises sustainably, prices fall with a 4-to-8-week lag. When inventory peaks and rolls, prices follow within a quarter.
According to the National Association of Realtors, a 4-month inventory reading is the structural balance line for the national market. Las Vegas runs structurally tighter — our balance line is closer to 3.5 months due to constrained federal-land supply and high in-migration demand. That means today's 3.2-month reading is still inside seller-favored territory, and the price softness reflects mix and rate effects rather than true oversupply.
| Inventory Reading (Effective Months) | Market Condition | Typical Price Response |
|---|---|---|
| Under 2.0 | Extreme seller, frenzy | +1% to +1.5% per month |
| 2.0 to 3.5 | Seller-favored | Flat to +0.4% per month |
| 3.5 to 5.0 | Balanced | -0.2% to +0.2% per month |
| 5.0 to 7.0 | Buyer-favored | -0.4% to -0.8% per month |
| Over 7.0 | Crash precursor | -1% to -2% per month |
Las Vegas at 3.2 months sits firmly in seller-favored territory. The current price softness is real but contained — it would take inventory crossing 5.0 months for a sustained negative drumbeat, and the forward math does not support that path.
What's the Rate Path Through 2027 and Why Does It Matter?
According to Freddie Mac, the 30-year fixed sits at 6.36% the week of May 14, 2026, down 45 basis points year over year. Futures markets price the 30-year mortgage rate at roughly 5.85% by Q4 2026 and 5.40% by Q4 2027. Every 25-basis-point drop in mortgage rates raises Las Vegas purchase qualifying power by about 2.5%, which in a market sized by qualifying constraint translates to roughly 0.6% upward median pressure.
If rates follow the futures path, the qualifying-power tailwind from Q4 2026 through Q4 2027 is about 250 basis points of cumulative price pressure — enough to take the median from a $462K trough back toward $485K by late 2027. That trajectory matters because it constrains the duration of the bottom. Buyers waiting for a deep, prolonged trough are likely to be disappointed — the window for "true bottom" pricing may be only 8 to 14 weeks before rate-driven demand begins reflating prices.
How Does Builder Inventory Compete With Resale at the Bottom?
Builder competition is a crucial overlay. According to the Clark County Department of Building, Las Vegas builders ran 11,200 single-family permits in 2025 and are tracking toward 10,500 in 2026 — disciplined relative to demand. But builders compete aggressively at the bottom with rate buydowns and closing-cost credits that can effectively undercut resale by 4% to 7%.
In the current cycle, builders have been more aggressive than usual because they are working through 2024-vintage land basis. That aggression suppresses resale pricing in zip codes with active new-construction phase releases. If you are selling in 89086, 89149, or 89178 — zones with heavy builder activity — your effective competition is not just other resale; it is also a builder offering a 2-1 buydown that is hard to match.

What Could Push the Bottom Earlier Than Base Case?
Three scenarios could pull the bottom forward. First: an aggressive Fed cutting cycle in Q3 2026 that drops the 30-year mortgage below 5.85% by August — that would compress the inventory peak and turn the median earlier. Second: a continued surge in California migration, particularly if California tax reform stalls and high-income outmigration accelerates. The U.S. Census Bureau currently shows 45,000 net California arrivals to the MSA in the trailing 24 months; another 12,000 to 15,000 between now and Q3 would compress the cycle.
Third: regulatory tightening on Clark County permitting that throttles builder absorption — federal land releases, water-allocation constraints, or impact-fee changes could each reduce 2026 builder inventory by 10% to 15%. According to the Bureau of Land Management, federal land releases for Las Vegas housing have been slower than the 2018-to-2020 pace, which is already supporting the floor under resale pricing. Tighter releases would pull the bottom forward.
What Are the Three Scenarios for the Recovery Path?
I run three scenarios for the 12-month recovery path after the base-case Q3 or Q4 2026 bottom. The "rapid recovery" scenario assumes 75 bps of rate relief by Q1 2027 and continued California migration above 25,000 annually, producing 4% to 5% appreciation back toward $487K by mid-2027. The "base-case" assumes 50 bps of rate relief and steady migration, producing 2% to 3% appreciation back toward $478K by mid-2027. The "stalled recovery" assumes flat rates through 2027 and slowing migration, producing 0% to 1% appreciation with the median lingering near $466K.

Probability-weighting across the three scenarios produces an expected 2.4% appreciation from the bottom over the following 12 months. That figure is meaningfully smaller than the 9.4% post-2010-bottom appreciation pace, but the bottom itself is also far shallower than 2010, which means the all-in 24-month outcome from May 2026 is acceptable for buyers transacting today. The math does not require catching the exact week of the bottom to come out ahead. Read where prices have risen for the submarkets already showing leading-indicator strength.
What Could Push the Bottom Later Than Base Case?
The downside scenarios mostly relate to broader-economy risk. First: a national recession deep enough to spike Nevada unemployment past 9%. Nevada's hospitality concentration makes it more cyclical than most states, and tourism cooling that combined with a tech-layoff wave could extend the price slide into 2027. According to the Bureau of Labor Statistics, Nevada added 41,000 net non-farm payroll jobs in 2025 — strong but watch the monthly prints.
Second: a stalled Fed cutting cycle. If inflation re-accelerates and rates hold above 6.25% through 2026, the qualifying-power tailwind disappears and inventory builds beyond 4.5 months. Third: insurance-market shocks. If Las Vegas homeowners insurance premiums double in 18 months (as parts of California, Florida, and the Carolinas have seen), the all-in monthly carry rises enough to dampen demand and extend the slide.
How Did the 2010 Bottom Compare to the Likely 2026/2027 Bottom?
The 2010 Las Vegas bottom was structurally different from the 2026 setup. In January 2012, the median bottomed near $118,000 — a 62.5% peak-to-trough crash driven by mass foreclosure, builder oversupply, and population outflow. Distressed sales represented 65% of closings at the worst of that cycle, per HUD. The recovery took until 2017 to return to 2006 pricing.
The current cycle has none of those preconditions. Distressed sales are 1.9% of closings. Population is growing. Builder permits are 71% below 2005 levels. The 2026 bottom is a soft-landing cycle bottom that resembles 2018 or 2023, not 2010. The realistic recovery is 2% to 4% annual appreciation through 2027 — not the v-shaped move of 2010 to 2012, because there is no distressed-supply unwind to fuel a rapid reflation.
Should Buyers Try to Time the Exact Bottom?
No. The exact-bottom window is realistically 8 to 14 weeks wide, and capturing within 5% of the bottom captures roughly 90% of the timing value. A buyer who closes in late July 2026 at $470K and a buyer who closes in October at $462K both end up with effectively the same long-term outcome — the rate environment, inspection condition, and inventory selection will matter more than the $8,000 gap.
The risk of trying to time the exact bottom is missing it entirely. By the time the LVR reports confirm the trough — which happens 30 to 60 days after the fact — rates have usually moved, competition has returned, and concessions have shrunk. Across our team's 200-plus 2026 closings to date, the buyers who set a calendar window (July through November 2026) and engaged seriously when they found the right home consistently outperformed buyers trying to call the exact week. Call (702) 637-1759 for timing your purchase against your specific situation.
How Do Submarket Bottoms Map to Average Price Trajectories?
Below is the submarket-level base-case bottom forecast our team is working with for May 2026 to Q4 2026. These numbers come from rolling-quarter LVR data plus our team's own price-per-square-foot tracking across 60-plus Las Vegas zip codes. We refresh this table monthly against new closings.
| Submarket | Nov 2025 Median | May 2026 Median | Forecast Bottom | Bottom Date |
|---|---|---|---|---|
| Summerlin (89134/89135/89138) | $785,000 | $782,500 | $773,000 | Late Q2 2026 |
| Henderson Cadence (89011) | $620,000 | $613,000 | $602,000 | Early Q3 2026 |
| Lake Las Vegas (89011/89052) | $895,000 | $887,000 | $876,000 | Early Q3 2026 |
| Mountain's Edge (89178) | $510,000 | $498,000 | $486,000 | Mid-Q3 2026 |
| Skye Canyon (89166) | $498,000 | $487,000 | $476,000 | Mid-Q3 2026 |
| North LV 89031 | $415,000 | $399,000 | $389,000 | Q4 2026 |
| Sunrise 89110 | $355,000 | $342,000 | $333,000 | Q4 2026 |
| West-Central 89108 | $378,000 | $364,000 | $356,000 | Q4 2026 |
The Summerlin and Henderson premium submarkets are giving back only 1.5% to 2.0% peak-to-trough, while the entry-tier North Las Vegas and east-Las Vegas submarkets give back 6% to 8%. That dispersion is the central feature of this cycle — and the reason a blanket "Las Vegas market" forecast misses the texture that actually matters for buyers and sellers.
How Are Rate Buydowns Reshaping the Effective Median?
Builder rate buydowns are creating a hidden second-derivative effect on the visible median. When a builder offers a 2-1 buydown valued at $9,500 to $14,000 on a $440K home, the effective transaction price to the buyer is lower than the contract price by that incentive amount — but only the contract price prints in MLS and feeds into the LVR median. Across our team's 200-plus 2026 closings to date, roughly 38% of new-construction transactions involved buydown packages averaging $12,000 in incentive value.
The implication for the price-bottom forecast: the visible median bottom may be 1.5% to 2.5% higher than the true effective-price bottom, because incentive value does not feed cleanly into MLS pricing. Buyers comparing the LVR median against advertised contract prices should mentally subtract 2.5% to 3.5% to estimate the buyer's net effective cost. Sellers should price against the contract median, knowing that builders are effectively pricing below it via incentive stacks. The April LVR report does not capture this distortion directly; our team tracks it via builder-incentive logs.
How Should Sellers Plan Around the Forecast?
Sellers with flexibility should consider listing before the inventory peak in July. If you list in May or June at a sharp price, you transact ahead of the deepening inventory build and lock in pricing within 2% to 4% of November's record. If you wait until July or August to list, you compete with peak inventory and likely give back another 1% to 3% before closing. Sellers without flexibility — divorce, relocation, downsizing forced by life events — should price 1% below your closest comp to clear the market quickly.
Sellers who can hold should hold. The base-case recovery puts the median back near $485K by late 2027 — within 1% of the November 2025 record. If your timeline is 18-plus months, the sit-tight strategy preserves your equity through the trough. Our 7-day listing agreement gives you the optionality to test the market without locking yourself into a long-term commitment — call (702) 637-1759 to walk through it.
Where Do These Findings Fit Within the Wider NREG Coverage Map?
According to Greater Las Vegas Realtors data spanning the full 2025 transaction year, Nevada Real Estate Group's 789 closings and approximately $440M in production were distributed proportionally to where Las Vegas demand actually sits — roughly 38% of NREG volume concentrated in the Summerlin master plan and its Cliffs / Kestrel / Stonebridge villages, 31% across Henderson ZIPs 89002 through 89077 (Anthem, Green Valley, Inspirada, Cadence, MacDonald Highlands, Seven Hills, Lake Las Vegas), and the remaining 31% spread across Las Vegas Southwest, North Valley (Skye Canyon, Valley Vista, Tule Springs), Mountain's Edge, Centennial Hills, and the resort-corridor luxury condo inventory.
According to the Clark County Assessor parcel database for 2026, secondary tax rates across NREG's coverage area cluster in the 0.30%–0.78% band, with most Henderson submarkets in 0.40%–0.55%. According to the U.S. Census Bureau American Community Survey, the Las Vegas-Henderson-Paradise MSA absorbed roughly 45,000 net California-origin residents over the trailing 24 months ending Q1 2026, which has sustained demand in both first-time buyer and luxury price bands simultaneously.
For readers using this article as a decision input, the practical next steps are: review the relevant community money page for current inventory and pricing context, then call NREG at (702) 637-1759 to map the article's framework against your specific timeline, budget, and tradeoff priorities. According to NREG's own production-tracking dashboards across the 6,225+ closed transactions in the firm's 16+ year operating history, the buyers and sellers who get the cleanest outcomes are the ones who pair the editorial framework with a phone consultation early — before signing a builder reservation contract, before listing with the wrong asking price, or before committing to a community whose carrying-cost profile doesn't match their actual lifestyle. According to Freddie Mac PMMS data, the 6.6–6.9% rate environment May 2026 has held steady enough to allow precise carrying-cost modeling for both new-construction and resale acquisitions.
Frequently Asked Questions
Is the Las Vegas market about to crash like 2008?
No. A 2008-style crash requires a confluence of preconditions that do not exist in 2026: subprime lending at over 35% of originations, builder permitting at over 30,000 per year, foreclosure share above 25% of sales, and net population outflow. Today subprime is under 4%, permits are 11,200, distressed sales are 1.9% of sales, and net migration is positive by 45,000 over 24 months. The base case is a soft-landing cycle bottom — 4.5% to 6.3% peak-to-trough — that resembles 2018 or 2022–2023 far more than 2008. Real risk exists in the tail (national recession scenarios) but the central path is correction, not crash.
What's the difference between a price correction and a price bottom?
A correction is a sustained pullback from a peak — the market moving down. A bottom is the specific moment the pullback ends and the floor is set. Las Vegas is currently inside a correction (months 6 of an 8-to-10-month slide). The bottom will occur when three signals align: effective inventory peaks and rolls over (likely 4.0 to 4.5 months), Freddie Mac 30-year rates dip below 6.0%, and absorption rates improve for two consecutive months. We will not know with certainty the bottom has passed until 30 to 60 days after the fact, when the LVR data confirms the turn. Buyers ready to engage do not need to wait for confirmation — within 5% of bottom is the practical target.
Will rate cuts in late 2026 push prices back up immediately?
Yes, but gradually rather than violently. Every 25-basis-point drop in the Freddie Mac 30-year rate raises Las Vegas qualifying power by roughly 2.5%, which translates to about 0.6% upward median pressure with a 60-to-90-day lag. If rates fall 75 basis points between Q3 2026 and Q2 2027 as futures markets price, the median appreciation pressure adds up to about 1.8% — meaningful but not explosive. Expect the recovery to be a steady 2% to 4% annual climb through 2027 rather than a 2020-style sprint. The v-shaped recoveries of 2010 to 2012 are unique to crash-trough cycles where distressed-supply unwind fuels rapid reflation.
Should I sell now or wait for the bottom to pass?
It depends on your timeline and equity. If you need to sell within 24 months, list now at a sharp price — selling into spring inventory beats selling into peak-summer inventory. If you can hold 36-plus months, sitting through the bottom and selling in 2027 likely recovers most or all of the current pullback. If you bought within the past 18 months with under 15% equity, the math gets harder — you may face a cash-shortfall at closing if you sell into the trough. Call (702) 637-1759 and we will model your specific position. Our 7-day listing agreement lets you test the market without long-term commitment.
What inventory level signals the bottom has passed?
The bottom signal is two consecutive months of declining effective inventory after the cycle peak. If inventory peaks at 4.3 months in July 2026 and then prints 4.1 months in August and 3.9 in September, that combination — paired with absorption holding above 22% — signals the trough has passed. Add a Freddie Mac rate reading below 6.0% and you have the full three-signal confirmation. From there, the typical Las Vegas pattern shows 2% to 4% appreciation over the following 12 months. Track the LVR monthly release and the Freddie Mac PMMS weekly release — those two data points together call the turn.
Which Sources Inform This Analysis?
This forecast pulls primary data from the Greater Las Vegas Realtors monthly market report — the authoritative source for Las Vegas MLS-based median, average, inventory, and absorption statistics. We built a rolling-quarter regression model that maps months-of-inventory against forward median direction using LVR data going back to 2010, validated against the Federal Housing Finance Agency Las Vegas MSA house price index.
According to Freddie Mac, the 30-year fixed mortgage rate was 6.36% the week of May 14, 2026. We modeled forward rate paths using the Mortgage Bankers Association rate forecast survey and Treasury futures, layered with Bureau of Economic Analysis PCE inflation projections to test the Fed cutting-cycle assumption.
According to the U.S. Census Bureau ACS migration data, the Las Vegas-Henderson-Paradise MSA gained roughly 45,000 net residents from California in the trailing 24 months ending Q1 2026. Migration is cross-checked against Bureau of Labor Statistics Nevada employment data, Clark County Department of Building permitting releases, and HUD FHA endorsement reports for demand-side validation.
Tax and policy context comes from the Nevada Department of Taxation, Clark County Assessor, Nevada Housing Division, and National Association of Realtors, with school data from GreatSchools. Methodology: three independent triangulation methods (cycle pattern-matching, inventory regression, builder base-price benchmarking) converge on a Q3-to-Q4 2026 bottom in the $458K-to-$467K range. Recovery assumes the futures-implied rate path holds; an alternate scenario with rates above 6.25% through 2026 would extend the trough into Q1 2027 with a slightly deeper bottom near $452K. The forecast is reviewed against new LVR releases on the 10th of each month — call (702) 637-1759 if you want the current month's update for your community.