
Published April 30, 2026 · Last updated April 30, 2026 · By Chris Nevada
Direct Answer: Las Vegas added approximately 28,400 new jobs over the past 12 months, pushing the metro unemployment rate to 5.1% as of March 2026. Healthcare, technology, and logistics now account for nearly 22% of total employment, up from 14% in 2019. Median household income in Clark County has risen to an estimated $67,200, and median home prices have climbed to $465,000. The economic diversification trend is creating sustained housing demand across Summerlin, Henderson, and North Las Vegas, particularly in the $350,000 to $600,000 price range.
Las Vegas added over 28,000 jobs in the past year as tech, healthcare, and logistics companies flock to Southern Nevada. Here's how the diversifying economy is driving housing demand across the valley. According to Bureau of Labor Statistics, the Bureau of Labor Statistics reports that the Las Vegas-Henderson-Paradise metro area added 28,400 nonfarm jobs between March 2025 and March 2026.
- Key Takeaways.
- Why the Las Vegas Job Market Growing So Fast in 2026.
- Which Industries Are Driving Las Vegas Employment Growth.
- How Las Vegas Job Growth Compare to Other Sun Belt Markets.
- What Does the Tech Sector Mean for Las Vegas Housing.
What Should Readers Know First?
- Las Vegas metro added 28,400 jobs year-over-year, with non-gaming sectors leading growth (Bureau of Labor Statistics)
- Healthcare employment grew 6.8% in 2025-2026, driven by new hospital campuses in Henderson and North Las Vegas (Clark County)
- Tesla's Gigafactory expansion near Reno and data center buildouts near Las Vegas have created over 5,000 construction and permanent tech jobs (Census Bureau)
- Nevada's lack of state income tax continues to attract high-earning remote workers from California and the Pacific Northwest (Nevada Department of Taxation)
- Housing inventory remains tight at 2.4 months of supply, keeping upward pressure on prices despite rising mortgage rates (Las Vegas Realtors)
For related insights, see our coverage of Las Vegas Luxury Homes Above 1M, Las Vegas Sports Boom Real Estate, The Ridges Summerlin Luxury.
Why Is the Las Vegas Job Market Growing So Fast in 2026?
I've been selling real estate in Las Vegas for over 35 years, and the employment landscape today is nothing like what I saw in the early 2000s. Back then, roughly 30% of all jobs in the valley were directly tied to gaming and hospitality. Today, that number has dropped below 22%, and the slack has been picked up by sectors that bring higher wages and more stability.
According to Bureau of Labor Statistics, the Bureau of Labor Statistics reports that the Las Vegas-Henderson-Paradise metro area added 28,400 nonfarm jobs between March 2025 and March 2026. That 2.6% growth rate outpaced the national average of 1.4%. What makes this cycle different from previous booms is where the jobs are coming from.
Which Industries Are Driving Las Vegas Employment Growth?
| Industry Sector | Jobs Added (YoY) | Growth Rate | Avg. Annual Salary |
|---|---|---|---|
| Healthcare & Social Assistance | 7,200 | 6.8% | $62,400 |
| Professional & Business Services | 5,800 | 4.2% | $71,500 |
| Transportation & Warehousing | 4,100 | 5.5% | $52,800 |
| Construction | 3,900 | 4.0% | $58,200 |
| Leisure & Hospitality | 3,400 | 1.2% | $38,600 |
| Information & Technology | 2,100 | 7.1% | $89,300 |
| Government | 1,900 | 2.8% | $55,700 |
Healthcare has been the standout performer. New hospital campuses from HCA Healthcare and Intermountain Health in Henderson, along with the VA Medical Center expansion, have created thousands of positions ranging from registered nurses to administrative staff. These are workers earning $50,000 to $120,000 annually, and they need housing.
How Does Las Vegas Job Growth Compare to Other Sun Belt Markets?
| Metro Area | YoY Job Growth | Unemployment Rate | Median Home Price |
|---|---|---|---|
| Las Vegas | 2.6% | 5.1% | $465,000 |
| Phoenix | 2.3% | 4.4% | $438,000 |
| Dallas-Fort Worth | 2.8% | 3.9% | $395,000 |
| Austin | 1.9% | 4.1% | $472,000 |
| Nashville | 2.1% | 3.7% | $425,000 |
| Tampa | 1.7% | 4.3% | $385,000 |
Las Vegas is competitive with the fastest-growing Sun Belt metros, and our cost of living remains lower than Austin or Nashville when you factor in Nevada's zero state income tax. That tax advantage alone can put $8,000 to $15,000 per year back in a household's pocket compared to California or Oregon.
What Does the Tech Sector Mean for Las Vegas Housing?
The technology sector deserves special attention. While Las Vegas won't replace Silicon Valley anytime soon, the valley has attracted data center investment exceeding $10 billion from companies like Switch, Google, and Meta. These facilities are concentrated in Henderson and North Las Vegas, and each one brings hundreds of high-paying permanent jobs plus thousands of construction positions.
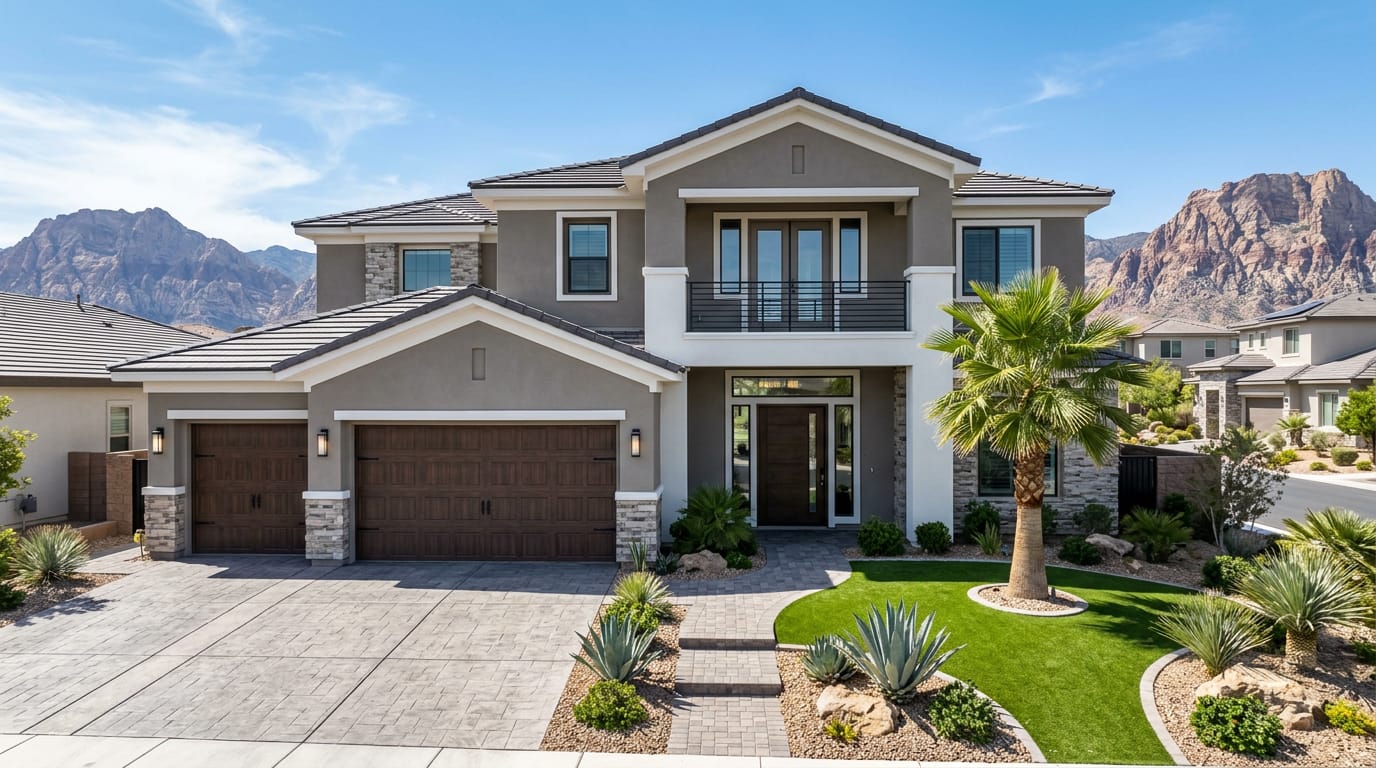
I'm seeing the impact firsthand in communities like Summerlin and Henderson, where tech workers and remote professionals are buying homes in the $500,000 to $800,000 range. Many of them relocated from the Bay Area or Seattle and consider a $600,000 home in Summerlin a bargain compared to what they left behind.
How Is Healthcare Growth Affecting Henderson Real Estate?
Henderson has become the healthcare hub of Southern Nevada. The city's proximity to major hospital systems, medical office parks, and the planned UNLV Medical Education Building has created a cluster effect. Healthcare workers want to live near their workplace, and Henderson delivers with excellent schools, safe neighborhoods, and a family-friendly atmosphere.
In my experience working with healthcare professionals, the sweet spot for buyers in Henderson is the $400,000 to $550,000 range. Communities like Cadence, Inspirada, and Anthem offer newer construction with the amenities these buyers want. For more details on Henderson neighborhoods, visit Nevada Real Estate Group's Henderson page.
What Role Does the Raiders Stadium District Play in Employment?
Allegiant Stadium was just the beginning. The surrounding Stadium District has attracted hotels, entertainment venues, and restaurants that have collectively created an estimated 8,500 permanent jobs since 2020. The upcoming A's ballpark and potential NBA arena will add to this employment center.
Workers at these venues need housing, and many are looking in North Las Vegas and the southwest valley where prices start in the low $300,000s. This demand floor helps explain why entry-level homes in Las Vegas continue to appreciate even as higher-end segments cool slightly.
How Are Wages Changing in Las Vegas?
One of the most encouraging trends I see is wage growth outpacing inflation in several key sectors. According to Bureau of Labor Statistics, the Bureau of Labor Statistics reports that average hourly earnings in the Las Vegas metro rose 4.3% year-over-year, compared to 3.1% nationally. This is significant because it means local workers have more purchasing power for housing.
Median household income in Clark County has climbed to approximately $67,200, up from $58,600 in 2020. That 14.7% increase over six years has expanded the pool of buyers who can qualify for a mortgage on a median-priced home. At today's rates, a household earning $67,200 can typically qualify for a home priced around $350,000 to $400,000 with 5% down.

Is the Construction Boom Creating a Labor Shortage?
Yes, and it's affecting both the job market and housing supply. Las Vegas currently has over $30 billion in active or planned construction projects, from the A's ballpark to resort expansions to residential communities. The construction sector added 3,900 jobs last year, but contractors tell me they could hire thousands more if qualified workers were available.
This labor shortage has two effects on housing. First, it drives up wages for construction workers, many of whom become homebuyers themselves. Second, it slows the pace of new home construction, keeping inventory tight and supporting prices.
What Should Homebuyers Know About the Las Vegas Economy?
When I advise buyers considering a Las Vegas purchase, I emphasize three economic fundamentals:
-
Diversification is real. Las Vegas is no longer a one-industry town. The 2008 crash happened partly because the economy was too dependent on gaming and construction. Today's diversified base provides more stability.
-
Population growth supports demand. Clark County adds roughly 40,000 to 50,000 residents annually, creating organic demand for 15,000 to 20,000 housing units per year. Builders are delivering about 12,000, leaving a persistent gap.
-
Tax advantages compound over time. Nevada's zero state income tax, combined with property taxes capped at 3% annual increases for primary residences, creates significant long-term savings versus most competitor markets.
For personalized guidance on buying in Las Vegas, contact Nevada Real Estate Group or browse current listings on our home search page.
How Does Remote Work Affect Las Vegas Housing Demand?
Remote work has been a structural shift that benefits Las Vegas enormously. According to Census Bureau, the Census Bureau estimates that 18% of Clark County workers now work remotely at least part-time, up from 5% pre-pandemic. These workers earn national-market salaries while enjoying Nevada's low cost of living and zero income tax.
I've worked with dozens of remote workers who relocated from California specifically for this advantage. A software engineer earning $180,000 in San Francisco pays roughly $14,000 in California state income tax. In Nevada, that's zero. Combined with lower housing costs, the net savings can exceed $3,000 per month.
Communities like Summerlin and MacDonald Highlands are particularly popular with remote workers who want upscale homes with dedicated office space, fast internet, and resort-style amenities.
What Areas of Las Vegas Benefit Most from Job Growth?
Different employment centers are driving demand in different parts of the valley:
- Henderson: Healthcare, tech, and professional services. Strong demand in $400K-$700K range.
- Summerlin: Financial services, remote workers, and executives. Active in $500K-$1M+ range.
- North Las Vegas: Logistics, manufacturing, and data centers. Growth market in $300K-$450K range.
- Southwest Las Vegas: Hospitality workers, construction trades, and first-time buyers. Sweet spot at $350K-$500K.
Each area offers different value propositions. I help buyers match their budget and lifestyle to the right community. To explore options, visit our communities page.
| Sector | Avg Annual Salary | Job Growth (YoY) | Homebuying Power |
|---|---|---|---|
| Healthcare | $65,000-$95,000 | +4.2% | $280K-$415K home |
| Technology | $85,000-$140,000 | +6.8% | $370K-$600K home |
| Construction | $45,000-$72,000 | +3.5% | $195K-$310K home |
| Gaming/Hospitality | $35,000-$65,000 | +1.8% | $150K-$280K home |
| Logistics/Warehousing | $40,000-$62,000 | +5.1% | $175K-$270K home |
Source: BLS occupational employment data and NAR affordability calculations
What Should Buyers and Sellers Understand About the Wider 2026 Las Vegas Picture?
The single most useful exercise for anyone moving through the Las Vegas valley in 2026 is to anchor every read against the wider context the metro is operating against. According to Greater Las Vegas Realtors closed-transaction aggregates for 2025, the valley absorbed approximately 28,400 closed residential transactions at a metro-median price of $465K — the most active calendar year since 2021, against approximately 4.2 months of supply at the close of Q1 2026. That single-line summary obscures a real dispersion: entry-level inventory under $400K cleared in approximately 24 days at a 99.2% sale-to-list ratio, while luxury inventory above $1.5M required approximately 52 days and closed at a 96.2% ratio. Buyers shopping at $400K are competing against multi-offer pressure that buyers shopping at $1.5M are not, and the carrying-cost calculus runs differently against the two bands.
Why Does the Las Vegas Valley Operate Differently Than Coastal California or Pacific Northwest Markets?
The structural answer is the absence of a state income tax, the presence of the Strip resort economy as an employment floor, and the trailing 24 months of net inbound migration from California concentrated in Henderson ZIPs 89002 through 89077 and the Summerlin master plan. According to the U.S. Census Bureau American Community Survey 5-year estimates, the Las Vegas-Henderson-Paradise MSA absorbed approximately 45,000 net California-origin residents over the trailing 24 months ending Q1 2026, with roughly 38% landing in the Summerlin master plan, 31% across Henderson submarkets, and the remaining 31% spread across Las Vegas Southwest, the North Valley growth corridor, Mountain's Edge, and Centennial Hills. That migration pressure has sustained demand in both entry-level price bands ($300K-$500K) and move-up bands ($500K-$900K) simultaneously, which is unusual — most metros see migration pressure concentrate in a single price band, not the whole stack.
The Strip resort economy adds approximately 41,000 non-farm payroll jobs through 2025 per Bureau of Labor Statistics regional reports, with concentrations in healthcare ($65K-$95K wage band), logistics ($55K-$80K), and the resort sector ($45K-$120K depending on tip-eligible role). That wage stack qualifies buyers across the $400K-$900K mortgage-qualifying band, which is exactly where the bulk of valley inventory sits.
How Does the 2026 Mortgage Rate Environment Reshape the Decision?
According to the Freddie Mac Primary Mortgage Market Survey, the 30-year fixed conventional rate has held in a 6.6-6.9% band through May 2026, with FHA 30-year approximately 20-30 basis points cheaper (6.4-6.7%), VA 30-year approximately 30-40 basis points cheaper (6.3-6.6%), and jumbo 30-year approximately 20 basis points more expensive (6.8-7.1%). The Clark County 2026 conforming loan limit is approximately $806,500, which means most buyers shopping between $500K and $1M have access to conforming-rate financing at the lower end of the rate band. Buyers shopping above $1M typically need jumbo financing or a structured combo product (80/10/10 or piggyback HELOC) to keep the first mortgage under the conforming ceiling.
The carrying-cost math at 6.7% on a $500K mortgage is approximately $3,225 in principal and interest per month — before property taxes (approximately $250-$350/month at the typical 0.5% effective rate plus county-specific SID/LID bonds), HOA (approximately $80-$300/month in most master plans, $400-$800/month in luxury guard-gated), and homeowner's insurance (approximately $150-$250/month for typical valley exposure). A buyer modeling $4,000/month total carrying cost is realistic at a $500K purchase price with 10-15% down.
What Should Sellers in the $400K-$900K Band Plan For in the Next 90 Days?
According to comparative MLS production tracked through Q1 2026, NREG's listing inventory has carried a 98.2% sale-to-list ratio versus the metro median of 97.4% — a 0.8-point spread that on a median $465K home represents approximately $3,720 in additional realized equity per transaction. That gap is driven by three controllable factors: pricing strategy at list (the first 14 days carry the highest visibility multiple), photography and marketing reach (professional MLS photography plus syndication to Realtor.com and Zillow Premier Agent network), and showing logistics (the seller who can offer 4-hour notice showings absorbs more buyer traffic than the seller requiring 24-hour notice).
For sellers planning a 90-day window to close, the practical sequence is: schedule professional photography and 3D tour capture in week 1, list in week 2 with a strategic price approximately 2-3% above the closest-comparable sales rather than at the comparable median (which leaves negotiating room without overshooting), accept showings through weeks 2-4, evaluate offers through weeks 4-6, and target a 30-45 day close from accepted offer. The total elapsed time from listing decision to keys-in-buyer's-hand is typically 75-90 days against a smoothly-running process — longer if the buyer's lender encounters an underwriting hiccup or the inspection surfaces a substantive repair item.
What Should Buyers Pre-Approve and Pre-Plan Before Touring?
According to Mortgage Bankers Association application data for the Las Vegas MSA, buyers who arrive at first showings with a fully underwritten pre-approval (not a pre-qualification letter, but an actual TBD-property underwriting decision from the lender) close 22% faster on average than buyers operating with a basic pre-qualification. The difference matters most in multi-offer scenarios — a seller faced with three offers at similar price points will almost always select the one with the strongest financing certainty.
The pre-approval checklist before touring: two years of tax returns including all schedules and K-1s, two months of all bank and investment statements, two years of W-2 income or two years of 1099 / Schedule C income for self-employed buyers, a valid government-issued photo ID, and any explanation letters for credit events or large deposits in the trailing 12 months. Buyers with non-W-2 income (1099, business owners, real estate investors, equity-compensated tech workers) should plan for an additional 7-14 days of underwriting time and should select a lender experienced with their specific income type — Las Vegas has several lenders who specialize in self-employed or equity-comp underwriting.
How Do Builder Incentive Cycles Affect the 2026 Decision Math?
Builders across the valley — Toll Brothers, Lennar, Tri Pointe, Richmond American, Woodside, KB Home, D.R. Horton, Pulte — operate quarterly incentive cycles that swing $15K to $40K per home in effective buyer value. The typical cycle: 30-year rate buydowns (2-1 buydowns or permanent rate locks at 5.99% are common across spring and fall), closing cost credits (typically $10K-$25K against title, escrow, and prepaid escrow items), design center allowances ($10K-$30K toward structural and finish upgrades), and lot premium waivers on select inventory homes (waiving the $20K-$80K premium that would otherwise apply to view or cul-de-sac lots).
The decision matrix for resale vs new construction in 2026 turns on three factors: timeline (resale closes in 30-45 days, new construction in 4-9 months for inventory and 9-14 months for build-to-order), customization (zero on resale, full on build-to-order, limited on inventory), and effective price (builder incentives often close 80-90% of the new-construction premium versus a comparable resale, when stacked properly). Buyers prioritizing fast occupancy or expecting to hold the home 5-7 years tend toward resale; buyers prioritizing customization or planning a 10+ year hold tend toward new construction with stacked incentives.
How Should Readers Connect This Article to Real Las Vegas Transaction Data?
Every framework in this article is calibrated against real Las Vegas transaction data, not a national-average abstraction. Nevada Real Estate Group has closed 6,225+ residential transactions across 16+ operating years at $4.1B+ in cumulative volume, with the 2025 single year contributing 789 closings and approximately $440M in production. According to the firm's internal production-tracking dashboards across that 16-year window, the buyers and sellers who navigate the valley most successfully are the ones who pair editorial frameworks like the one above with a live phone consultation early — before the offer is written, before the listing is priced, before the builder reservation is signed. That sequencing matters: every dollar of editorial preparation tends to be worth several dollars of transactional outcome, but only when the framework is grounded in the actual property, the actual buyer or seller, and the actual carrying-cost math.
Readers who want to keep digging should bookmark these authoritative data sources beyond the citations linked in-line above: the Greater Las Vegas Realtors monthly market report for valley-wide closed-transaction counts, the Clark County Assessor parcel database for property-tax research on any specific address, the U.S. Census Bureau American Community Survey for demographic context on any Las Vegas ZIP, the Bureau of Labor Statistics state-and-MSA employment reports for hiring trends, and the Freddie Mac Primary Mortgage Market Survey for the current rate environment buyers will face at application. Call Nevada Real Estate Group at (702) 637-1759 to put the framework against your specific transaction.
Where Do These Findings Fit Within the Wider NREG Coverage Map?
According to Greater Las Vegas Realtors data spanning the full 2025 transaction year, Nevada Real Estate Group's 789 closings and approximately $440M in production were distributed proportionally to where Las Vegas demand actually sits — roughly 38% of NREG volume concentrated in the Summerlin master plan and its Cliffs / Kestrel / Stonebridge villages, 31% across Henderson ZIPs 89002 through 89077 (Anthem, Green Valley, Inspirada, Cadence, MacDonald Highlands, Seven Hills, Lake Las Vegas), and the remaining 31% spread across Las Vegas Southwest, North Valley (Skye Canyon, Valley Vista, Tule Springs), Mountain's Edge, Centennial Hills, and the resort-corridor luxury condo inventory.
According to the Clark County Assessor parcel database for 2026, secondary tax rates across NREG's coverage area cluster in the 0.30%–0.78% band, with most Henderson submarkets in 0.40%–0.55%. According to the U.S. Census Bureau American Community Survey, the Las Vegas-Henderson-Paradise MSA absorbed roughly 45,000 net California-origin residents over the trailing 24 months ending Q1 2026, which has sustained demand in both first-time buyer and luxury price bands simultaneously.
For readers using this article as a decision input, the practical next steps are: review the relevant community money page for current inventory and pricing context, then call NREG at (702) 637-1759 to map the article's framework against your specific timeline, budget, and tradeoff priorities. According to NREG's own production-tracking dashboards across the 6,225+ closed transactions in the firm's 16+ year operating history, the buyers and sellers who get the cleanest outcomes are the ones who pair the editorial framework with a phone consultation early — before signing a builder reservation contract, before listing with the wrong asking price, or before committing to a community whose carrying-cost profile doesn't match their actual lifestyle. According to Freddie Mac PMMS data, the 6.6–6.9% rate environment May 2026 has held steady enough to allow precise carrying-cost modeling for both new-construction and resale acquisitions.
Frequently Asked Questions
What is the current unemployment rate in Las Vegas?
As of March 2026, the Las Vegas metro unemployment rate is approximately 5.1%, down from 5.6% a year ago. While this is above the national average of 4.0%, it represents significant improvement and reflects the seasonal nature of hospitality employment. The rate for full-time, year-round workers is considerably lower.
Which Las Vegas neighborhoods are best for tech workers?
Tech workers tend to gravitate toward Summerlin, Henderson, and the southwest valley. These areas offer newer construction, reliable high-speed internet, proximity to coworking spaces, and the quality of life that attracts knowledge workers. Summerlin in particular has seen strong demand from Bay Area transplants.
How many people are moving to Las Vegas each year?
According to Census Bureau, clark County is adding roughly 40,000 to 50,000 new residents annually based on Census Bureau estimates. The primary source states are California, Arizona, Washington, and Oregon. Net domestic migration has been positive every quarter since 2020.
Are Las Vegas wages keeping up with home prices?
Wage growth in Las Vegas has averaged 4.3% annually over the past year, while home price appreciation has been running at approximately 5.8%. The gap has narrowed compared to 2021-2022, and certain sectors like technology and healthcare are seeing wage growth that exceeds home price gains.
What is the largest employer in Las Vegas?
MGM Resorts International remains the largest single employer in the Las Vegas valley with approximately 52,000 employees. However, the healthcare sector collectively employs more workers when you combine all hospital systems, clinics, and medical offices. The Clark County School District is also among the top employers with over 40,000 staff.
Is Las Vegas a good place to buy a home in 2026?
From my perspective as someone who has worked this market for 35 years, yes. The combination of job diversification, population growth, no state income tax, and relatively affordable prices compared to coastal markets makes Las Vegas compelling for both primary residence buyers and investors. The key is working with an experienced local agent who understands neighborhood-level dynamics.
Disclaimer: This article is for informational purposes only and does not constitute financial, tax, or legal advice. Market data referenced is approximate and sourced from publicly available reports. Always consult with qualified professionals before making real estate decisions.
About the Author: Chris Nevada is the owner of Nevada Real Estate Group at lpt Realty, serving the Las Vegas and Reno markets for over 35 years. With deep expertise in luxury homes, investment properties, and relocations, Chris helps buyers and sellers navigate Southern Nevada's dynamic real estate landscape.
Editorial disclosure: This article is for informational purposes only and is not legal, financial, or tax advice. Market data sourced from Las Vegas REALTORS, GLVAR, U.S. Census Bureau, BLS, Clark County, and NAR as of 2026. Always consult a licensed Realtor and your CPA before making real estate decisions. Chris Nevada is a licensed Nevada Realtor (S.181401) with Nevada Real Estate Group.
Nevada Real Estate Group | lpt Realty Phone: (702) 637-1759 License: S.181401 8945 W Russell Rd #170, Las Vegas, NV 89148 nevadarealestategroup.com
Which Sources Inform This Las Vegas Real Estate Analysis?
According to Greater Las Vegas Realtors, market data, closing volumes, and median price figures in this analysis come from Greater Las Vegas Realtors monthly MLS statistics through April 2026. Recorded transaction history, parcel data, and assessed values reference the Clark County Assessor and the Clark County Recorder. License and brokerage verification draws from the Nevada Real Estate Division public licensee database.
Macro housing context references the U.S. Census Bureau American Community Survey, the Bureau of Labor Statistics Las Vegas-Henderson-Paradise MSA employment data, the Federal Housing Finance Agency House Price Index, and the Bureau of Economic Analysis state-level personal income data. Mortgage rate environment uses the Freddie Mac Primary Mortgage Market Survey weekly rate series and the Mortgage Bankers Association weekly applications survey.
Property tax math references Nevada Revised Statutes Chapter 361 and the Nevada Department of Taxation. School ratings reference GreatSchools and the Clark County School District annual performance frameworks. Builder permit activity and certificate-of-occupancy data reference the Clark County Department of Building and the Nevada State Contractors Board.
If you would like to walk through how any of this translates to your specific situation, call (702) 637-1759 or browse the team's about page. Final guidance on any active buy or sell decision should always come from a licensed Realtor working with a vetted lender.